I gifted myself an RTL-SDR compatible USB dongle for Christmas and have enjoyed poking around the airwaves with it. Most recently aircraft have caught my attention.
While so far I have not had any luck receiving voice transmissions from local air traffic, I have been able to receive ADS-B messages on 1090 MHz with relative ease. Using the awesome Dump1090 program I could see traffic in real time. This was exciting for about 30 minutes. So my next thought was to capture traffic over time and see what types of patterns emerged. The rest of this post is about my first attempt at this.
Setup
My gear is quite basic. I have the NooElec NESDR Mini 2+ with a 800/1900MHz dual band antenna from a cell phone repeater hooked up to it. Definitely not ideal, but it works. The antenna the SDR comes with would have probably worked just as well (or poorly).
I recorded about a day of traffic, piping the --raw output of dump1090 to a
custom python script that dropped any packet that was not 14 bytes long. This
was a simple way to remove some of the packets that did not have position
reporting which is currently all I am interested in.
The ouput was parsed by another python script into a KML file. This script grouped packets by ICAO (International Cicil Aviation Organization) unique ID and then generated a track with the position data. Parsing the coordinates was much more complicated than I would have guessed. Relying on the skimpy information here I managed to get the code working. In the future I'll probably just let dump1090 do the parsing.
Anyway... now for the good stuff.
Results
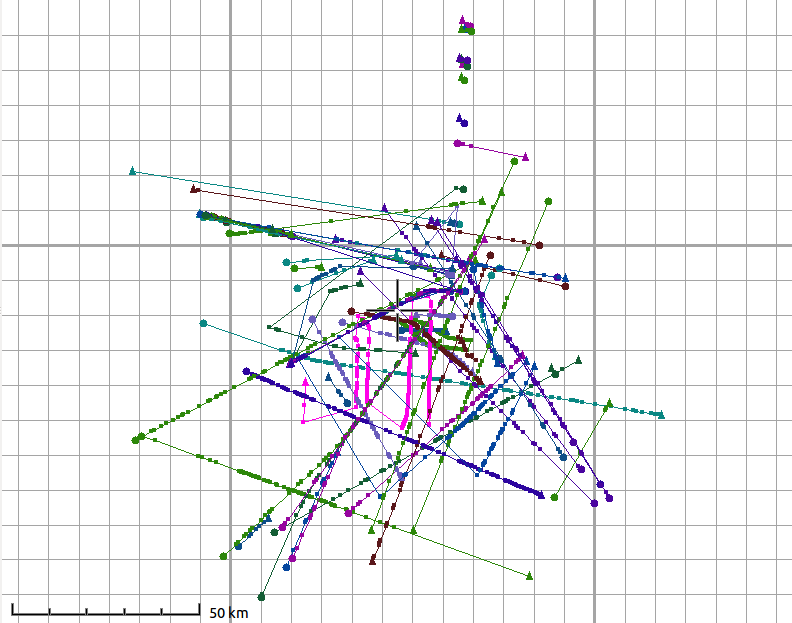
Over the day of recording I received 31618 14-byte packets. Of those, 2210 included position data for 93 unique aircraft.
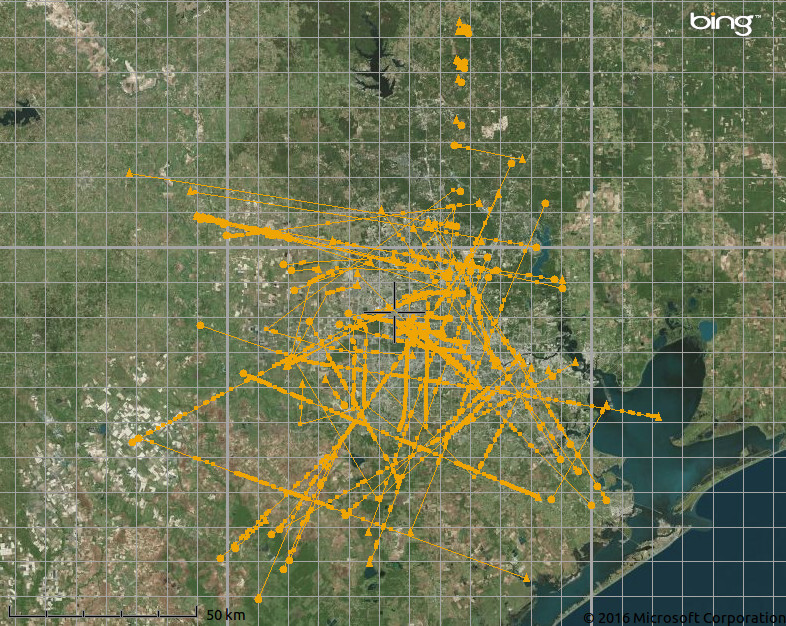
Unfortunately Viking (the KML viewer I was using) chooses pretty bad default colors for the tracks, especially when viewing on satellite images. In the next image I have selected the tracks so they are all orange. What a mess.
Found one aircraft track in particular to be quite interesting:

Almost looks like a search pattern of some sort. I decided to look up the ICAO ID to see if I could learn something. Luckily airframes.org has a great database for this type of stuff:
Registration  N441EH
Manuf.        Cessna
Model         441
Type          C441
c/n           441-0351
i/t           L2T
Selcal         -
ICAO24        A54EC0
Reg / Opr     SURDEX CORP
built         1985
test reg       -
delivery      2005-02-07
prev.reg       -
until          -
next reg       -
status        active
Google points us directly at the Surdex Webpage and we learn that its a company that does mapping and other GIS work. All of a sudden those flight tracks make sense! Looks like we caught them mapping part of Houston.
I'll continue playing with this setup. Future work will include:
- Proper 1090 MHz antenna
- Higher antenna elevation
- Calculation of altitude
- Utilization of other packets for tail number, heading, etc.
- Set track colors in KML that are actually visible
Update (2016/01/31)
Ran another capture over half a Saturday and got a lot more activity. My setup used a small ARM computer running dump1090 and relied on the "Base Station Format" output rather than the raw output. Using the more featureful fork at MalcomRobb/dump1090 I was able to get timestamped CSV-ish ASCII for the packets.
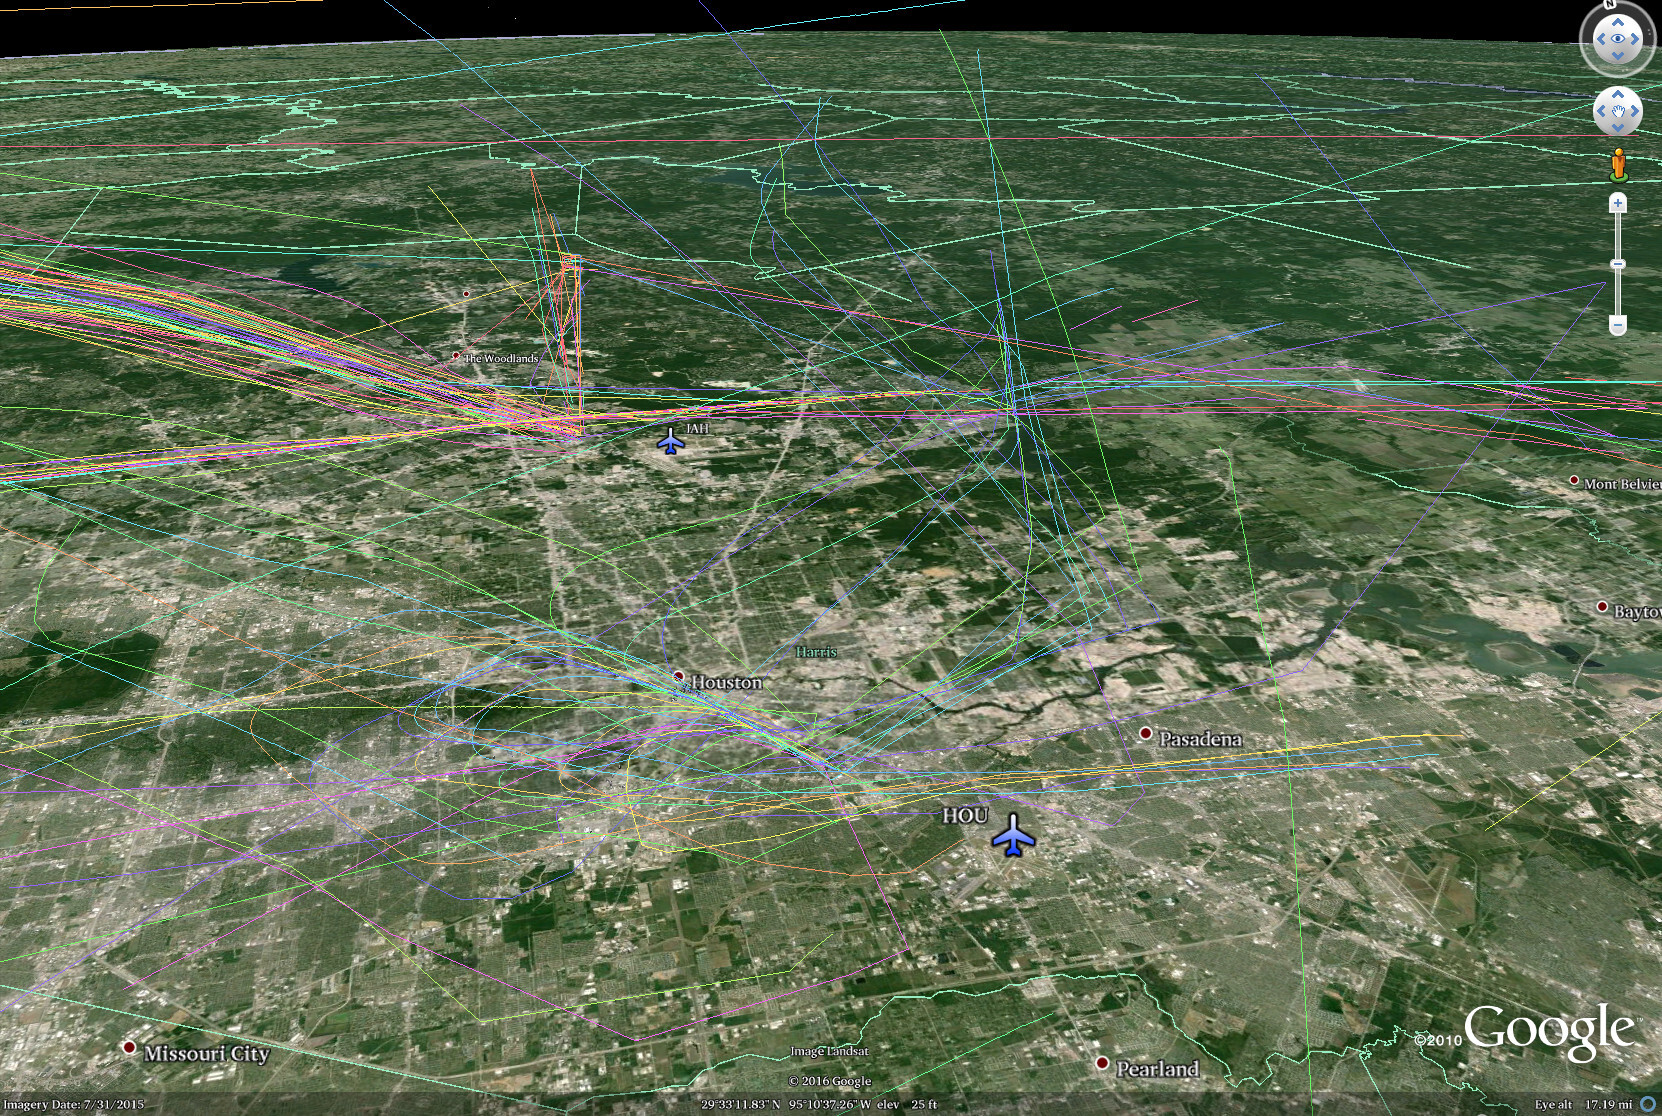
The new data now includes altitude! Houston is a busy place so the following image will likely be pretty unclear. You can download the KML here and view it yourself.

As you can see I added some code to colorize the tracks. Additionally I now visualize them in Google Earth so I can appreciate the 3D nature of the data better.
Check out activity near the airports (haven't figured out thumbnails with Frog yet)
The paths for getting in and out of HOU and IAH are very obvious. The high density of tracks at IAH shows just how much more volume they deal with. I like how the tracks for HOU turn immediately to avoid IAH traffic. There also seems to be some sort of low altitude corridor between the two airports.
For some reason the tracks and the airports don't line up very well. I will need to do some digging to see where the error is being introduced. Perhaps another weekend.