Background
I've wanted some sort of Vector Network Analyzer for a long time but they are expensive pieces of lab equipment. Luckily some clever hackers out there have come up with a design for this type of instrument that is "good enough" for casual use.
I ordered a NanoVNA V2 because the price was reasonable and other folks on the internet have had good luck with the design. Its an open source project with many users.
As soon as it arrived I measured a 2.4GHz WiFi antenna and was pleased to see reasonable results. It requires calibration each time you change measurement ranges, but the procedure is fairly painless.
Tonight I got to put it to good use.
ADS-B Antenna Build
Previously I had used a 900MHz antenna to receive ADS-B signals, as demonstrated in Aircraft Near Me. It worked ok, but I knew the performance was suboptimal because the signals are transmitted at a center frequency of 1090 MHz.
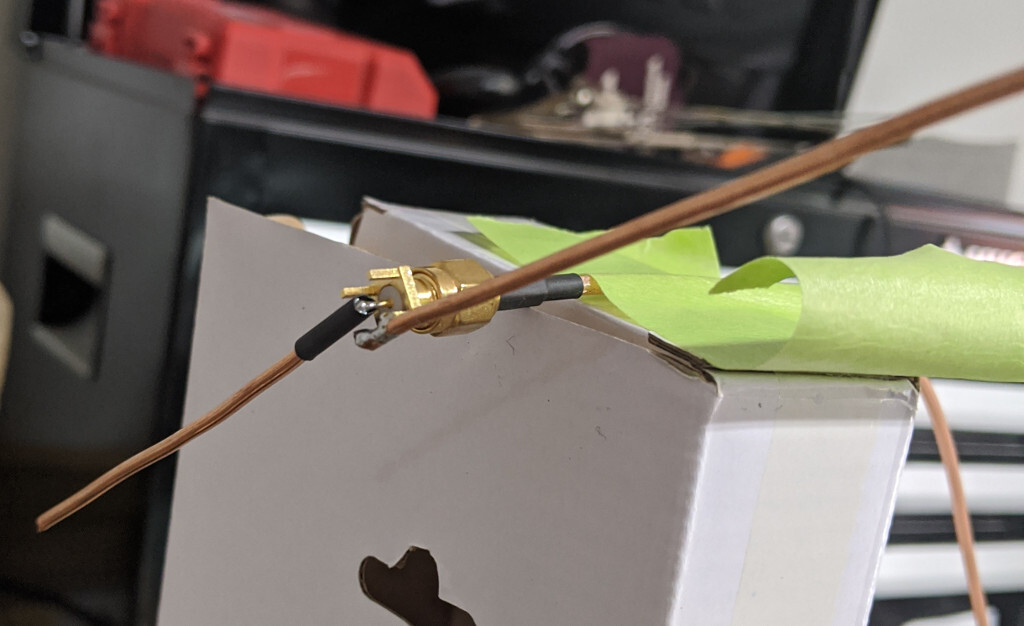
So I decided to build a 1090 MHz dipole and use the NanoVNA to tune it. The construction is simple, just some 12 AWG solid core wire soldered to a PCB mount SMA connector.
I built it with the wire on each leg longer than necessary (8cm) so there would be material to remove to tune it. The initial measurement made sense, a longer dipole has a lower characteristic frequency.
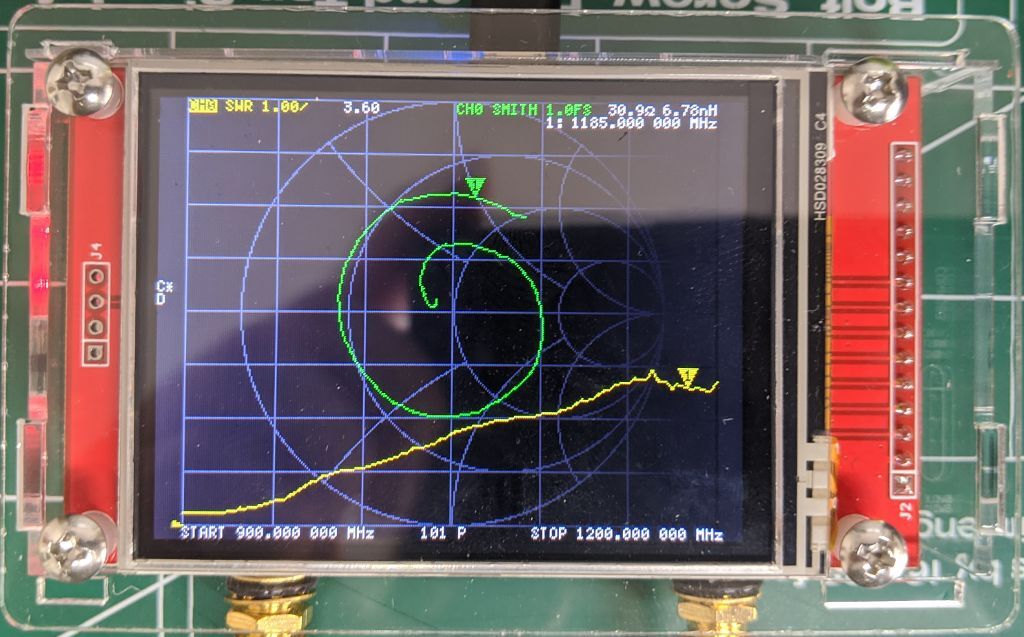
Shown in the image on the yellow plot is the SWR, or Standing Wave Ratio, of the antenna. It is a measurement of how well the antenna transmits our signal. Any portion of the signal power not transmitted is reflected back and forms a standing wave on the transmission line.
For best performance, we want this to be 1.0 at the desired frequency. You can see in the image it is closer to 3.0 at 1090 MHz (note the start and end frequencies in the bottom corners).
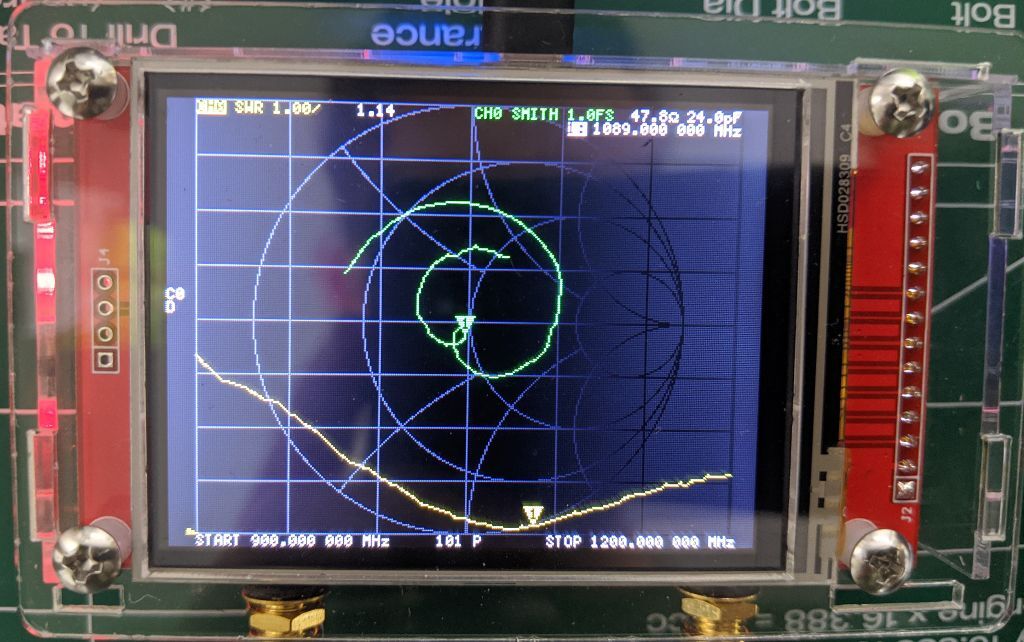
After trimming the length of the antenna legs, the SWR at the target frequency is 1.14. You can see the dip in the SWR almost centered at 1090 MHz. I remembered to move the measurement marker this time, so the value is shown in the upper left corner of the display.
I trimmed it again after this photo to attempt to center the dip. While the minimum became more centered, the SWR did increase slightly. Oh well, it is still pretty good.
So far we have ignored the green line, which is the Smith chart for the network. It is a plot of complex impedance and frequency. Into a perfectly matched load (which is desirable) we would expect it to form a dot in the center of the graph. Few antennas are matched over such a large frequency range. We see a curling plot across the band, but the marker is showing up close to center which means we are doing ok at the target frequency.

I installed the antenna using the complex, carefully built antenna mast shown above /s.
For quick ADS-B visualization I have taken to using this fork of dump1090 which outputs in a convenient format connected to Virtual Radar. The later tool runs just fine with Mono on Linux.
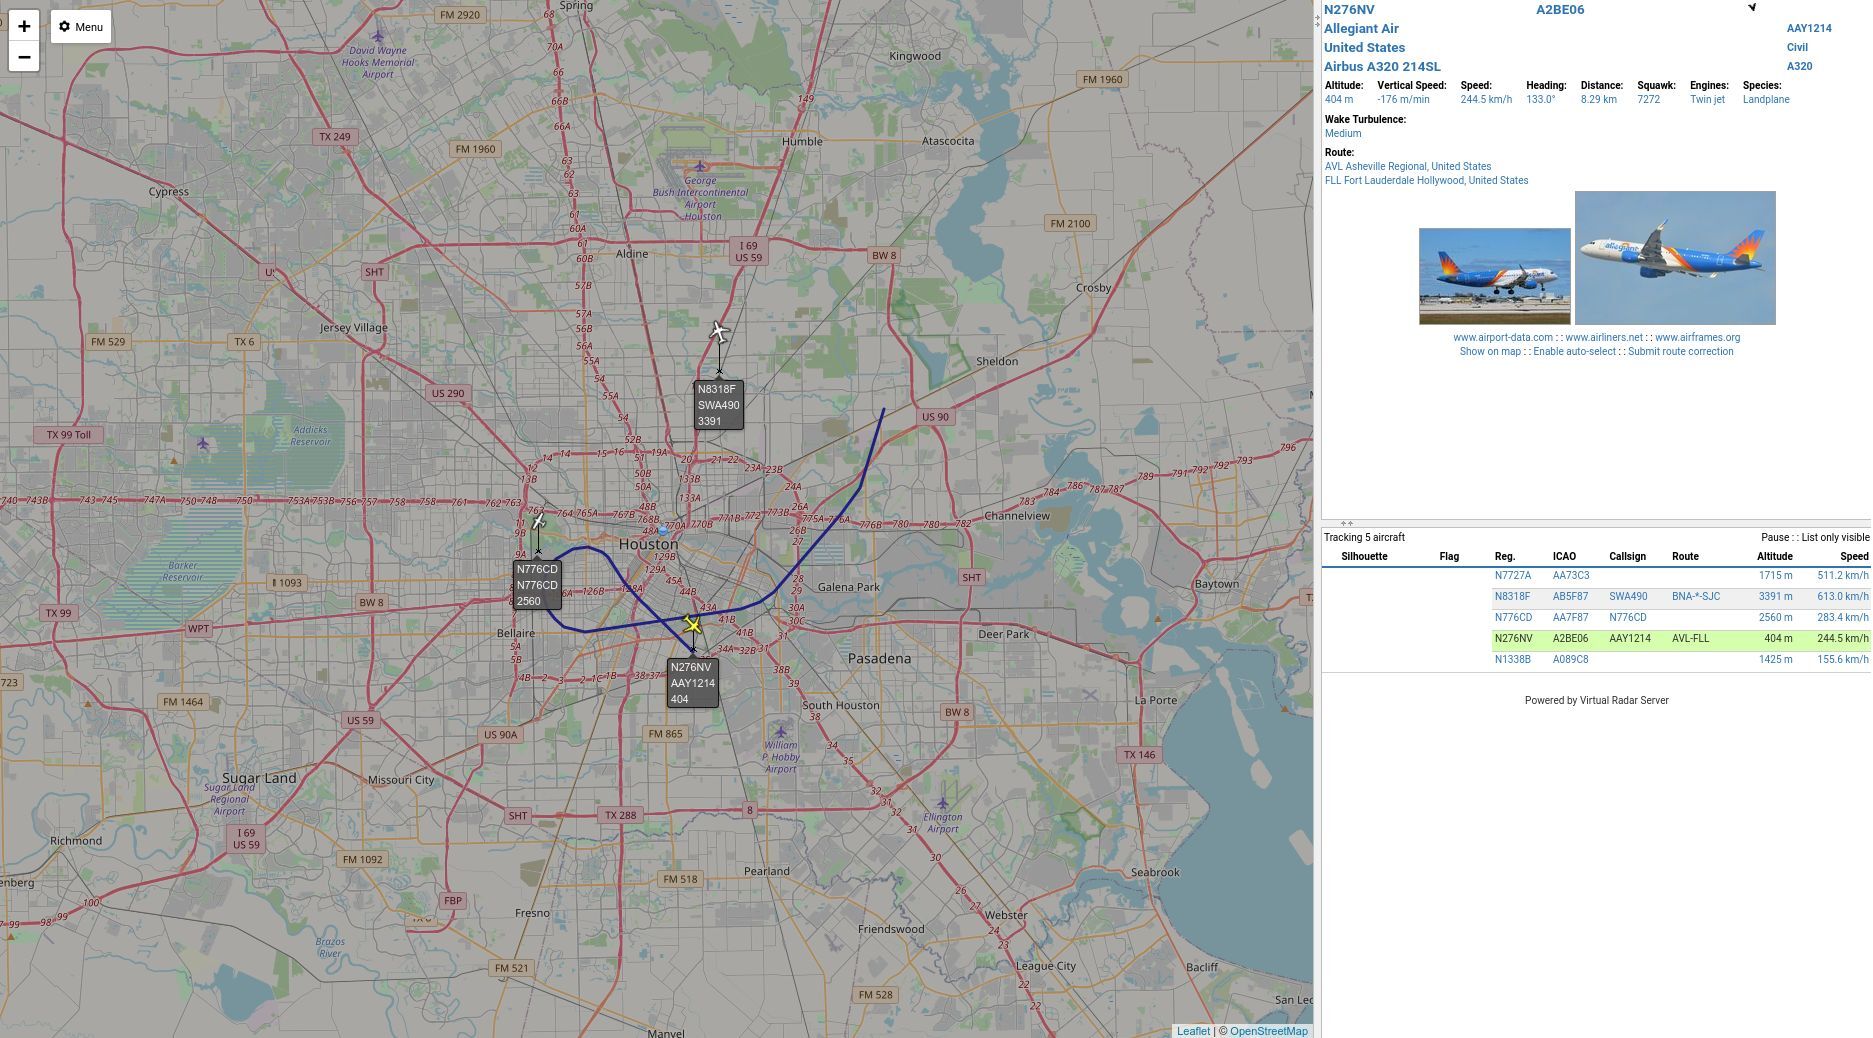
Check out the plane going in to land at HOU!
Right off the bat I see better range than my other antennas. I think the performance is pretty good for being in the second story window of a town-home in an urban area.
FM Trap
After having such a great time with the dipole I decided to measure an FM trap (band stop filter) that I built a while back. The goal of this filter is to block the strong RF signals emitted from terrestrial FM radio stations. These signals can interfere with other VHF signal reception. So what we want is a lot of attenuation in the frequencies used for FM radio.
To help think about the frequencies we are dealing with, imagine tuning to radio stations in your car. You might be surprised to find that you have already memorized the USA FM radio band limits: 88 to 108 MHz.
I based the design on one from the LNA4ALL blog. However, I can be a lazy man, and instead of winding the coils myself I just used surface mount inductors. I had no idea if this choice had compromised the design. Now is the time to find out!
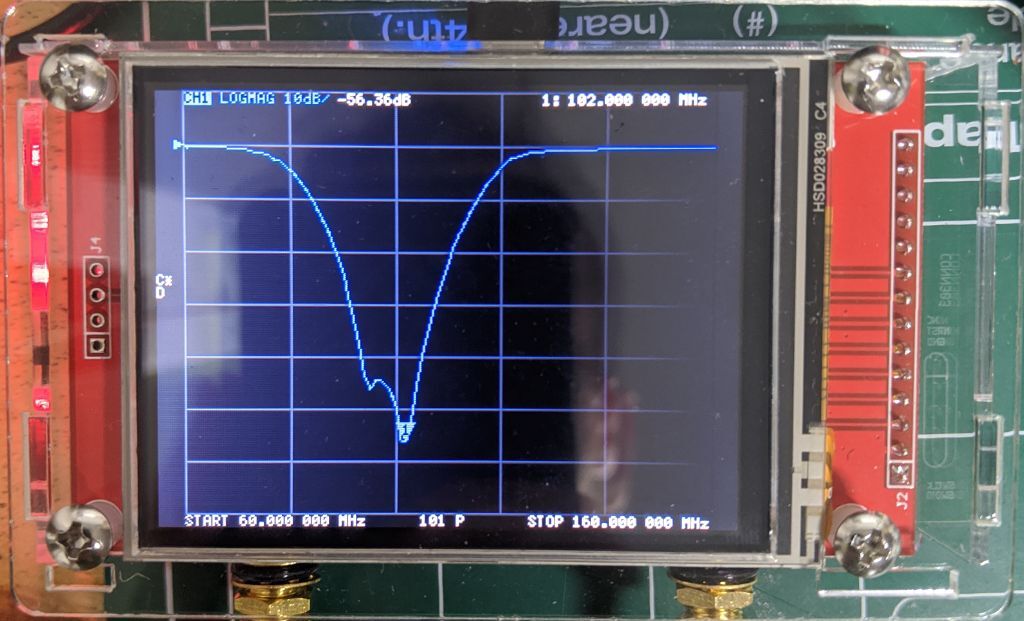
Note that this measurement is attenuation through a network, rather than the reflected power (SWR) measurement we took before.
For those not familiar with Decibels, -56dB means that the amplitude of signals at the measured frequency are attenuated by a factor of almost 1000. Compared with the simulated performance, my implementation matches fairly well (though the null isn't quite as deep):
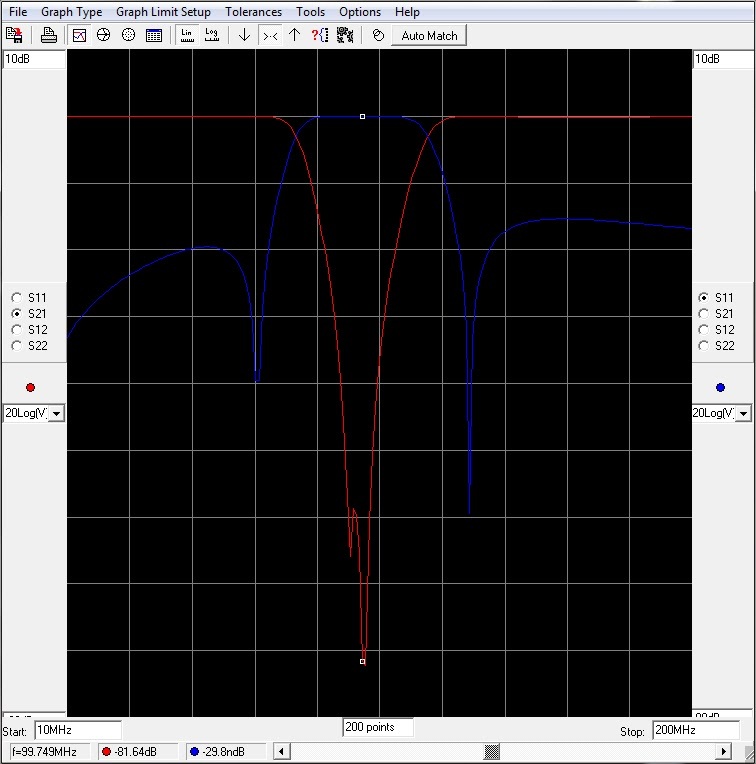
So it looks like my homemade FM trap is actually doing something useful.